Sign in with Google
TikTok no longer feels like an experiment for brands—the platform is a top-three traffic driver for many U.S. companies in 2025. Yet the difference between a clip that reaches 200 people and one that racks up two million views often comes down to how well you read the numbers hiding in TikTok’s dashboards. In this guide, you’ll learn which analytics matter most for a United States audience and what practical actions you can take when the data points start blinking red (or green).
1. Sheer size and buying power
The U.S. now hosts more than 150 million active TikTok users—about 45 % of the population, according to Statista’s 2025 update. Even small percentage gains in retention or click-through translate into thousands of extra customers.
2. Algorithmic sandboxing
TikTok’s recommendation system still prioritizes viewer location, device language, and SIM metadata. That means your creative is competing inside an American test bubble before crossing borders. If you don’t win U.S. watch time quickly, distribution stalls.
3. Rapid content cycles
U.S. trends peak and fade faster than in many other markets. The analytics windows you monitor in Indonesia or Germany (often seven days) can compress to 48 hours stateside.
Understanding exactly which indicators predict breakout velocity lets you react before the For You Wave passes.
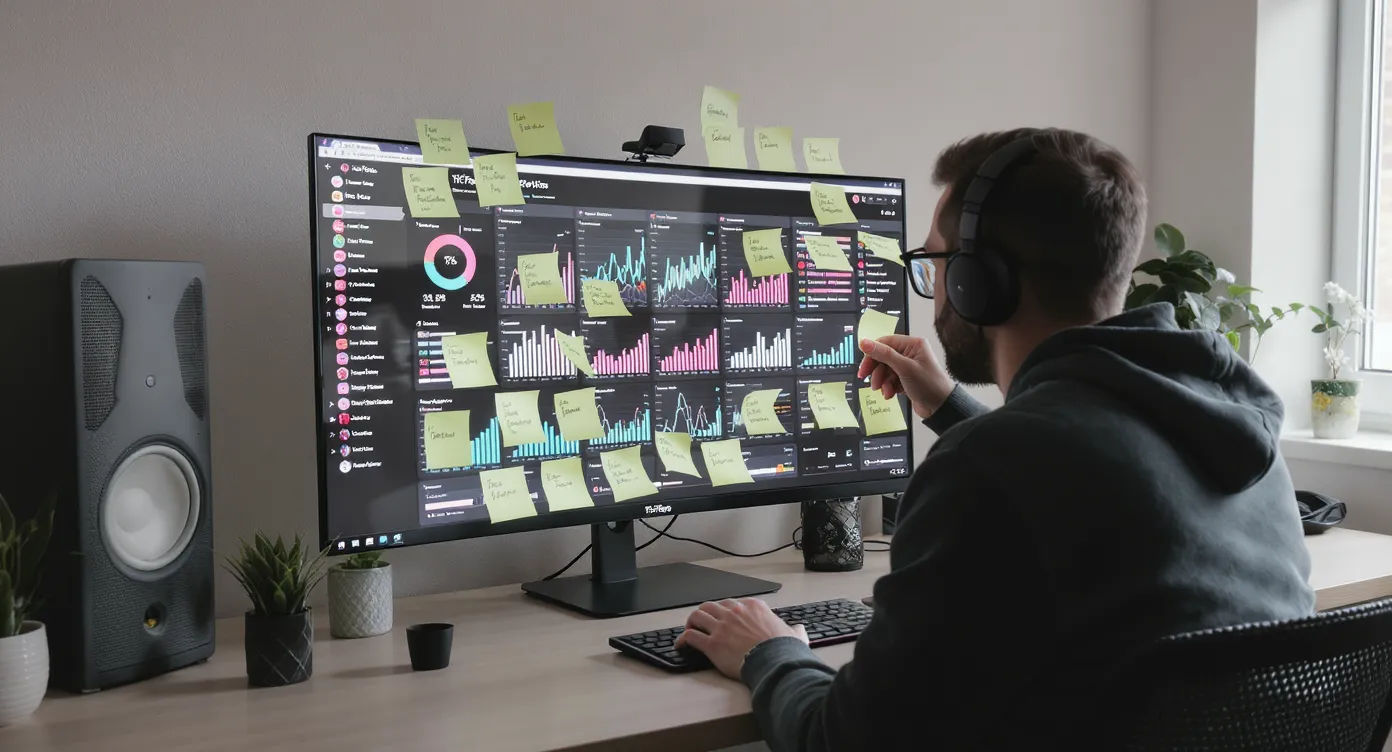
TikTok’s native “Video Analytics” and “Followers” tabs already surface dozens of metrics. The list below prioritizes the ones that most reliably forecast U.S. reach and revenue.
Why it matters: TikTok’s own Creator Academy confirms that watch time is the #1 ranking signal after viewer satisfaction surveys. In the U.S. benchmark studies we ran at TokPortal, clips with average watch time above 11.3 seconds earned 5× more organic impressions than those below 7 seconds.
How to respond:
- Tighten the first three seconds—cut empty “Hey guys!” intros.
- Front-load a curiosity gap (“I tested Amazon’s cheapest drone so you don’t have to…”).
- Use on-screen text to preview the payoff.
A U.S. completion rate of 45 % or higher on videos under 30 seconds is a strong indicator of “stickiness.” Anything under 30 % usually signals a structural problem. Split-testing hook variations across two separate American accounts via TokPortal is an efficient way to diagnose creative issues without killing overall channel velocity.
TikTok confirmed at VidCon 2024 that external sharing (copy link, repost) weighs more heavily than likes for the For You algorithm. U.S. viewers tend to share polarizing or utility-focused content (e.g., “3 hidden iOS hacks”). If your Share Rate is lagging (<0.5 %), add:
- List formats (“Top 4…”)
- Surprising stats (cite credible U.S. source)
- Direct calls (“Send this to a friend who…”) in the last three seconds.
TikTok search queries in the U.S. grew 81 % YoY (Google Internal, 2025). Inside Video Analytics, drill into Search traffic. High impressions here indicate you’re ranking for intent-based queries—gold for evergreen leads. Boost visibility by:
- Writing keyword-rich closed captions (CC) rather than relying on auto-generated text.
- Including a one-line answer to the query in the first five seconds.
U.S. audience activity often bifurcates into two spikes—7 a.m. to 9 a.m. and 7 p.m. to 11 p.m. Eastern Time—mirroring commute and couch scroll habits. Schedule premiers inside these windows. If you manage overseas production teams, TokPortal’s scheduler automatically converts time zones to hit the East-Coast curve without 3 a.m. alarms.
The new “Sound analytics” panel shows how many viewers tap the track. High clicks suggest the audio itself is discoverable. If Sound CTR is >2 %, consider remixing or stitching your own clip to ride the trend for an extra 48 hours.
For brands driving funnel actions, the PV→F ratio predicts community growth. A healthy U.S. benchmark is 12–18 %. Drop-offs often mean:
- Your bio lacks a clear value promise.
- Branding in videos is inconsistent (different logo, color palette).
Update visuals or rewrite the bio with a single benefit line (“Daily New York-based finance tips”).
Merchants with TikTok Shop US access should monitor Product Page Views. A View-to-Add-to-Cart (ATC) rate above 8 % is now typical for mid-ticket CPG items, according to TikTok Shop data dashboards (June 2025). Anything lower warrants tighter demonstration shots or UGC reviews stitched on Day 2.
While native numbers get you 80 % of the way, third-party platforms can surface competitive or predictive signals.
- Trendpop: Tracks top 100 U.S. trends and shows half-life curves—handy for deciding if a meme is already fading.
- Google Trends (TikTok filter): Cross-validate whether a hashtag is gaining wider web traction.
- CapCut Creative Center: Offers AI-predicted view ranges for hooks before you publish.
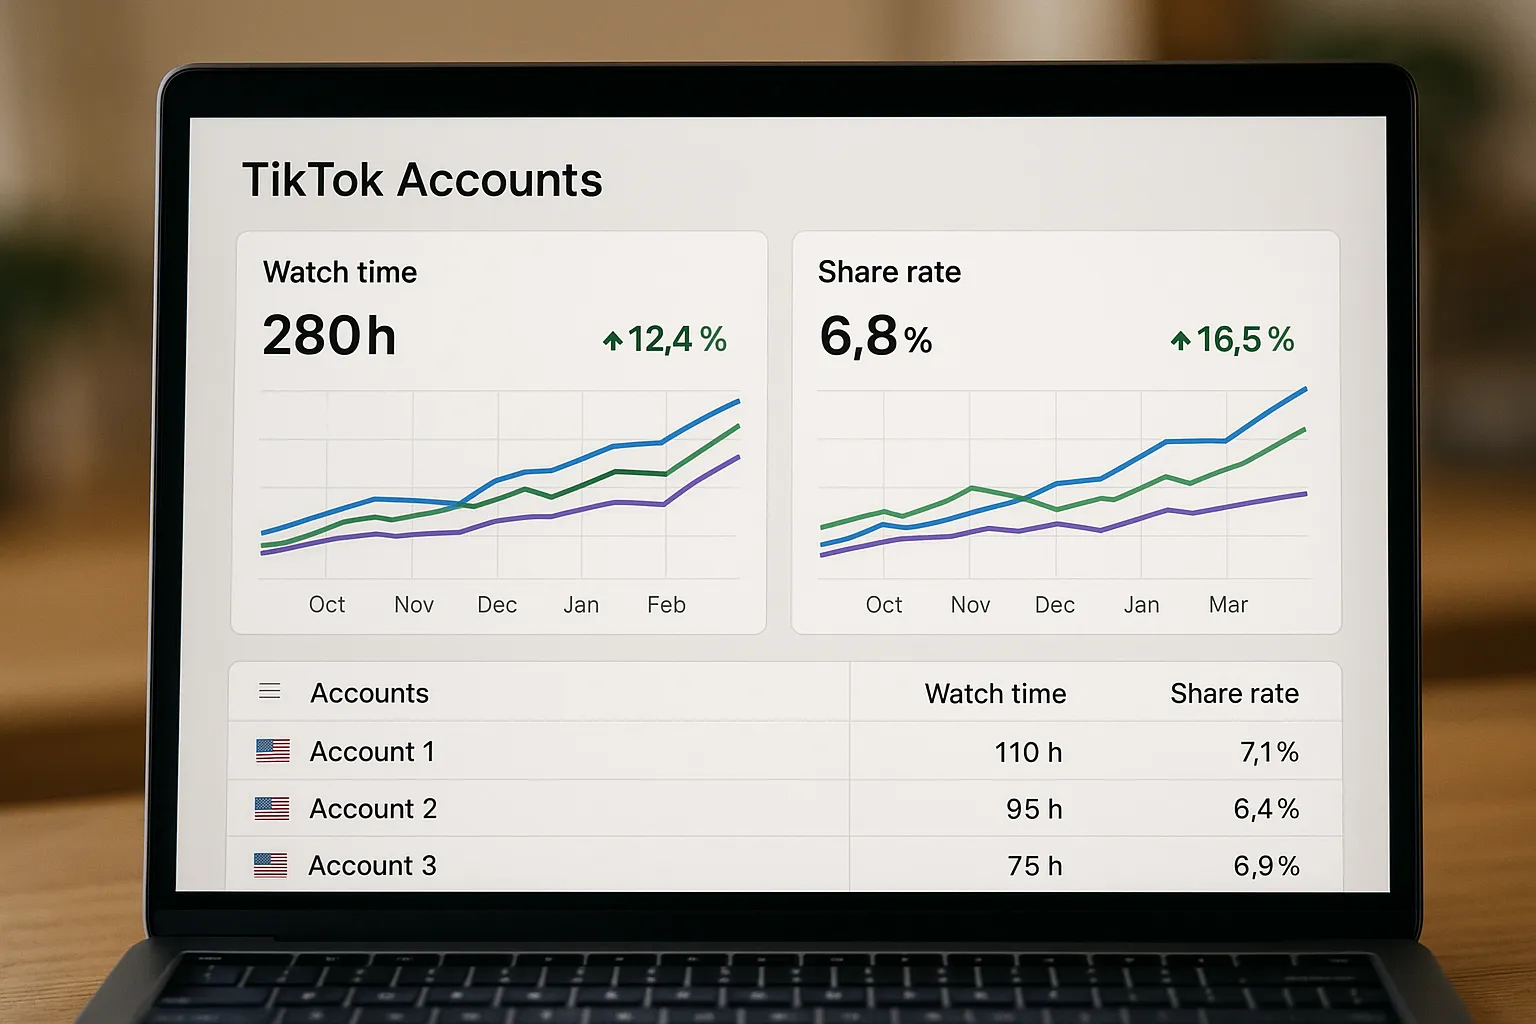
TokPortal pipes these external feeds back into a single dashboard, so you can compare “Watch Time” with trend momentum without juggling five tabs.
Below is a fast-reaction framework our customer success team uses when U.S. metrics dip.
1. Watch Time Tanks (<7 s)
• Re-edit the first 5 seconds; swap to a pattern-break thumbnail.
• Re-upload to a test U.S. account via TokPortal to avoid depressing the main channel.
2. Completion Rate Flatlines at 25 %
• Insert a mid-video “topic cliffhanger” (e.g., “But the real cost shocked us…”).
• Cut final 20 % runtime if it delivers no new value.
3. Shares Under 0.5 %
• Add explicit share CTA in text overlay.
• Incorporate contrarian data (“Most budgeting apps fail—here’s why…”).
4. Follower Activity Skews West Coast
• Post duplicate tests at midnight EST to capture 9 p.m. PST scrollers.
• Consider a dedicated Pacific-time account if split exceeds 60 / 40; TokPortal can clone content legally while geofencing.
5. Search Traffic <5 % in Tutorials
• Rename video file and on-screen title to include primary keyword (“how to clean white sneakers”).
• Re-export captions with formatted H2 subheadings.
6. TikTok Shop ATC Rate <8 %
• Insert price overlay early; U.S. consumers dislike hidden cost reveals.
• Stitch influencer reaction videos to rebuild trust.
An eco-laundry brand used TokPortal to manage three U.S. sub-accounts (general; “MomTok”; “Student Deals”). Baseline watch time sat at 6.9 s and Share Rate at 0.4 %. By shortening intros, filming native caption hooks, and nesting a suspense beat at second 9, average watch time jumped to 13.2 s and shares rose to 1.3 %. The main account’s reach subsequently expanded from 22 K to 180 K daily U.S. impressions—without paid ads.
- Pull 30-day averages for Watch Time, Completion, Share Rate, Saves.
- Identify outlier clips (+ / − 2σ) and dissect hooks or formats.
- Review Follower Activity by hour; adjust scheduler for Daylight Saving changes.
- Check top Search terms; plan at least one response video.
- Audit bio and link flow against PV→F and click metrics.
- For TikTok Shop sellers, evaluate ATC and Purchase Intent; refresh pinned comments with discount codes if needed.
What is a good average watch time for U.S. TikTok videos? Aim for 9–12 seconds on sub-30 second clips. Exceeding 50 % video length strongly increases reach.
How often should I check TikTok analytics? At minimum weekly. Daily checks are recommended during campaign launches or trend spikes.
Can I run multiple U.S. TikTok accounts without risking bans? Yes—if each account is genuinely U.S. registered and avoids simultaneous log-ins from foreign IPs. TokPortal handles unique devices and SIM verification for safe scaling.
Do the same analytics apply to paid Spark Ads? Core metrics like Watch Time still matter, but CPC and Conversion Rate become additional benchmarks in paid scenarios.
What tools combine analytics from several U.S. accounts? TokPortal offers a consolidated dashboard, while Trendpop and Metricool provide broader social analytics.
Knowing your numbers is half the battle; deploying creative tweaks fast is what turns analytics into real growth. TokPortal lets you schedule, publish, and A/B test unlimited U.S. TikTok accounts—without VPN headaches or algorithmic throttling.
Sign up for a free strategy call at TokPortal.com and discover how effortless analytics-driven growth can be when your content lands in front of the right American viewers every single time.

 Any question? Contact us.